An Unpatched Kernel Bug
› apple's AMDRadeonX4150 kext triggered a kernel panic...why?
1/16/2018
love these blog posts? support my tools & writing on patreon :)


Background
I'm on a plane again...flying to ShmooCon. Stoked! On Sunday (Jan 21st), I'll be giving a talk; "Get Cozy with OpenBSM Auditing". Hope to see you there!

Taking a break from working on my talk, I decided instead to poke around on my new MacBook. A few minutes later, my laptop panics. This is odd as I'm simply playing in user-mode. Of course though, I'm stoked - I mean, who doesn't like a macOS kernel bug?
In this short blog post, we'll analyze the panic report in order to pinpoint the offending instruction and at least uncover the immediate cause of the panic. As we'll see (un?)fortunately the bug does not immediately appear to have any meaningful security implications (save for perhaps a kernel information leak)...but maybe someone with more knowledge of the kernel and graphic card kexts will disagree ;) For the rest of us, hopefully walking thru the panic report will be an informative exercise!
Analyzing a Kernel Panic
Let's start with some system info:
- macOS version: 10.13.2
  $ uname -a
  Darwin Patricks-MacBook-Pro.local 17.3.0 Darwin Kernel Version 17.3.0:
  root:xnu-4570.31.3~1/RELEASE_X86_64 x86_6
- kernel panic report:
$ /Library/Logs/DiagnosticReports/Kernel_2018-01-15-185538_Patricks-MacBook-Pro.panic
  $ less Kernel_2018-01-15-185538_Patricks-MacBook-Pro.panic

  *** Panic Report ***
  panic(cpu 6 caller 0xffffff8008b6f2e9): Kernel trap at 0xffffff7f8c7ba8b1, type 14=page fault

  registers:
  CR0: 0x000000008001003b, CR2: 0xffffff80639b8000, CR3: 0x0000000022202000, CR4: 0x00000000003627e0
  RAX: 0x0000000000000564, RBX: 0x0000000000000564, RCX: 0x0000000000000020, RDX: 0x000000000000002a
  RSP: 0xffffff92354ebc80, RBP: 0xffffff92354ebce0, RSI: 0x00000000000fbeab, RDI: 0xffffff92487b9154
  R8:  0x0000000000000000, R9:  0x0000000000000010, R10: 0x0000000000000010, R11: 0x0000000000000000
  R12: 0xffffff80639b6a70, R13: 0xffffff92354ebdc0, R14: 0xffffff92354ebdd4, R15: 0x0000000000000000
  RFL: 0x0000000000010297, RIP: 0xffffff7f8c7ba8b1, CS:  0x0000000000000008, SS:  0x0000000000000010
  Fault CR2: 0xffffff80639b8000, Error code: 0x0000000000000000, Fault CPU: 0x6, PL: 0, VF: 1

  Backtrace (CPU 6), Frame : Return Address
  0xffffff92354eb730 : 0xffffff8008a505f6
  0xffffff92354eb780 : 0xffffff8008b7d604
  0xffffff92354eb7c0 : 0xffffff8008b6f0f9
  0xffffff92354eb840 : 0xffffff8008a02120
  ....

  Kernel Extensions in backtrace:
  com.apple.iokit.IOAcceleratorFamily2(376.6) @0xffffff7f8b2b0000->0xffffff7f8b345fff
  com.apple.kext.AMDRadeonX4150(1.6) @0xffffff7f8c7b4000->0xffffff7f8cf20fff

  BSD process name corresponding to current thread: kernel_task

  Mac OS version:
  17C88

  Kernel version:
  Darwin Kernel Version 17.3.0: Thu Nov  9 18:09:22 PST 2017; root:xnu-4570.31.3~1/RELEASE_X86_64
  Kernel slide:     0x0000000008600000
Ok, that's a lot of info - but as we'll see, it's everything we need to pin-point the immediate cause of the crash.
Let's start at the top:
panic(cpu 6 caller 0xffffff8008b6f2e9): Kernel trap at 0xffffff7f8c7ba8b1, type 14=page fault
The second line of the kernel panic report tells us the system panicked due to a page fault ('type 14=page fault'). Such faults are usually indicative of an invalid read or write of an unmapped page of memory.
Next, are the registers and their values at the time of the faulting instruction (i.e. the instruction that trigged the page fault). We'll come back to these in a second, but for now note the value of RIP. This register, the program counter, holds the address of the faulting instruction: 0xffffff7f8c7ba8b1
Following this, the panic report contains the address of the memory that when accessed, triggered the page fault: 0xffffff80639b8000
Fault CR2: 0xffffff80639b8000, Error code: 0x0000000000000000, Fault CPU: 0x6 ...
The panic report also contains a backtrace which allows us to determine the sequence of method or functions calls that lead up to the execution of the faulting instruction:
  Backtrace (CPU 6), Frame : Return Address
  0xffffff92354eb730 : 0xffffff8008a505f6
  0xffffff92354eb780 : 0xffffff8008b7d604
  0xffffff92354eb7c0 : 0xffffff8008b6f0f9
  0xffffff92354eb840 : 0xffffff8008a02120
  0xffffff92354eb860 : 0xffffff8008a5002c
  0xffffff92354eb990 : 0xffffff8008a4fdac
  0xffffff92354eb9f0 : 0xffffff8008b6f2e9
  0xffffff92354ebb70 : 0xffffff8008a02120
  0xffffff92354ebb90 : 0xffffff7f8c7ba8b1
  0xffffff92354ebce0 : 0xffffff7f8c7ba40f
  0xffffff92354ebd60 : 0xffffff7f8c7b85e8
  0xffffff92354ebda0 : 0xffffff7f8c7b9db2
  0xffffff92354ebe00 : 0xffffff7f8b2b3873
  0xffffff92354ebe50 : 0xffffff7f8b2bd473
  0xffffff92354ebe90 : 0xffffff7f8b2bcc7d
  0xffffff92354ebed0 : 0xffffff8009091395
  0xffffff92354ebf30 : 0xffffff800908fba2
  0xffffff92354ebf70 : 0xffffff800908f1dc
  0xffffff92354ebfa0 : 0xffffff8008a014f7
Once we've determine what kexts these addresses belong to (and possibly slide them to account for kASLR), we'll have a backtrace that maps to actual function names.
Following the backtrace, the panic report contains the kernel extensions (and their loaded addresses) that appear in backtrace. It's likely that one of these contains the instruction which triggered the page fault (and thus panic):
- kext: com.apple.iokit.IOAcceleratorFamily2
loaded at: 0xffffff7f8b2b0000 - kext: com.apple.kext.AMDRadeonX4150
loaded at: 0xffffff7f8c7b4000
Let's summarize what we now know from parsing the kernel panic report:
- the kernel panicked due to a page fault accessing memory at 0xffffff80639b8000.
- the address of instruction (held in RIP) that triggered the page fault is: 0xffffff7f8c7ba8b1.
- the com.apple.iokit.IOAcceleratorFamily2 and com.apple.kext.AMDRadeonX4150 kexts appear in the backtrace.
- the kernel was slid by 0x0000000008600000.
Starting at the bottom of the backtrace are addresses that belong to the kernel proper. Let's load this from /System/Library/Kernels/kernel into the Hopper disassembler. Due to the fact that kASLR slides the kernel in memory, we need to tell Hopper to rebase this image. Click 'Modify' then 'Change File Base Address'. Enter the kASLR slide value listed in the kernel panic report 0x0000000008600000, plus 0x100000 (0xffffff8008700000):

Once the kernel image is rebased, hit 'G' and enter the address at the bottom of the backtrace, 0xffffff8008a014f7:

As we can see in the following disassembly, this address maps to an instruction immediately following a call instruction:

When the CPU encounters such a call instruction, it saves the address of the next instruction on the stack. This allows it to know where to return, when the call has completed. When the kernel is preparing the panic report, it generates the backtrace by walking the stack and finding these saved addresses.
Thus, when we encounter a backtrace address such as 0xffffff8008a014f7, the call instruction that immediately proceeds this, is a function that was invoked leading to the faulting instruction. So here for example, we know the call rcx at 0xffffff8008a014f5 was invoked by the kernel 'en-route' to the crash.
We continue the process of 'walking up' the backtrace which gives us insight to the sequence of events that led up to the crash:
- kernel.call_continuation()
0xffffff8008a014f5 call rcx - kernel.IOWorkLoop::threadMain()
0xffffff800908f1d6 call qword [rax+0x1a8] - kernel.IOWorkLoop::runEventSources()
0xffffff800908fb9c call qword [rax+0x120] - kernel.IOInterruptEventSource::checkForWork()
0xffffff8009091392 call r11 - com.apple.iokit.IOAcceleratorFamily2.IOAccelEventMachine2::hardwareErrorEvent()
0xffffff7f8b2bcc78 call IOAccelEventMachine2::restart_channel() - com.apple.iokit.IOAcceleratorFamily2.IOAccelEventMachine2::restart_channel()
0xffffff7f8b2bd46d call qword [rax+0x160] - com.apple.iokit.IOAcceleratorFamily2.IOAccelFIFOChannel2::restart()
0xffffff7f8b2b386d call qword [rax+0x208] - com.apple.kext.AMDRadeonX4150.AMDRadeonX4150_AMDAccelChannel::getHardwareDiagnosisReport()
0xffffff7f8c7b9dac call qword [rax+0xb00] - com.apple.kext.AMDRadeonX4150.AMDRadeonX4150_AMDGraphicsAccelerator::writeDiagnosisReport()
0xffffff7f8c7b85e2 call qword [rax+0x258] - com.apple.kext.AMDRadeonX4150.AMDRadeonX4150_AMDAccelChannel::writeDiagnosisReport()
0xffffff7f8c7ba40a call AMDRadeonX4150_AMDAccelChannel::writePendingCommandInfo - com.apple.kext.AMDRadeonX4150.AMDRadeonX4150_AMDAccelChannel::writePendingCommandInfoDiagnosisReport()
0xffffff7f8c7ba8b1 mov r8d, dword [r12+rax*4] - kernel.hndl_alltraps()
0xffffff8008a0211b call _kernel_trap
Specifically, upon finding some work to do, a kernel thread called into the com.apple.iokit.IOAcceleratorFamily2 kext to handle a hardware related error case.
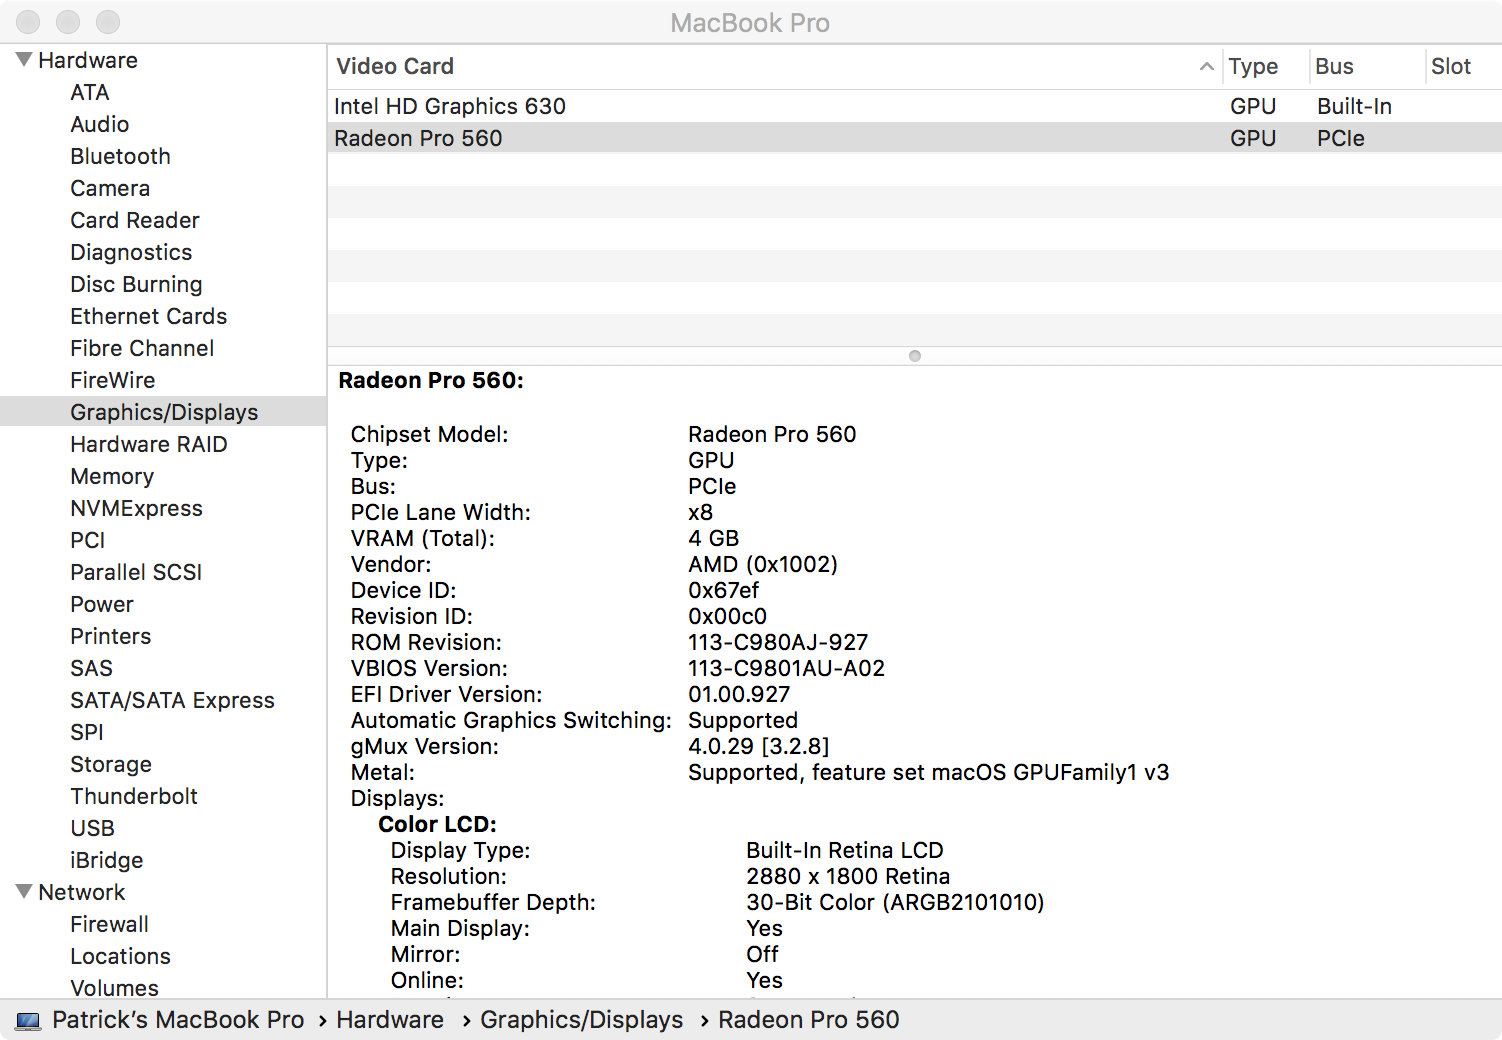
This kext, com.apple.iokit.IOAcceleratorFamily2, then invoked the restart_channel method. This in turn called down into a 'model-specific' kext, com.apple.kext.AMDRadeonX4150. This apparently is the appropriate kext that interfaces with my AMD Radeon Pro 560 graphics card:

As part of restarting the 'channel', a hardware diagnostic report is created. Specifically, com.apple.kext.AMDRadeonX4150 invokes its AMDRadeonX4150_AMDAccelChannel::writeDiagnosisReport method. This calls the writePendingCommandInfoDiagnosisReport method.
Astute readers will notice that the 11th address in the backtrace, is not a call instruction but rather a move.
0xffffff7f8c7ba8b1 mov r8d, dword [r12+rax*4]
Moreover this address, 0xffffff7f8c7ba8b1, found within Apple's com.apple.kext.AMDRadeonX4150 kext, matches the value contained in RIP in the kernel panic report. Also note, the next address in the backtrace, is proceeded by a call back into the kernel proper to handle a trap (call _kernel_trap)...such as a page fault! Clearly then, this move instruction is directly responsible for the panic!

So now we've identified the instruction that triggered the page fault (as well as the path taken to get there). Taking a closer look at this instruction, we see it's computing an address by adding some value (RAX*4) to a base register, R12. This address is then dereferenced into R8d. As the kernel panic report contain the register values at the time of this faulting instruction, we can (re)compute this address:
  $ less Kernel_2018-01-15-185538_Patricks-MacBook-Pro.panic

  registers:
  CR0: 0x000000008001003b, CR2: 0xffffff80639b8000, ...
  RAX: 0x0000000000000564, RBX: 0x0000000000000564, ...
  RSP: 0xffffff92354ebc80, RBP: 0xffffff92354ebce0, ...
  R8:  0x0000000000000000, R9:  0x0000000000000010, ...
  R12: 0xffffff80639b6a70, R13: 0xffffff92354ebdc0, ...
  RFL: 0x0000000000010297, RIP: 0xffffff7f8c7ba8b1, ...
mov r8d, dword [r12+rax*4]
R12: 0xffffff80639b6a70
RAX: 0x0000000000000564
R12 + RAX*4 = 0xffffff80639b6a70 + (0x564 * 4) = 0xffffff80639b8000
R12: 0xffffff80639b6a70
RAX: 0x0000000000000564
R12 + RAX*4 = 0xffffff80639b6a70 + (0x564 * 4) = 0xffffff80639b8000
The (re)computed address, 0xffffff80639b8000 should look familiar - it's the value of the memory address listed in the kernel panic report that when accessed, triggered the page fault:
Fault CR2: 0xffffff80639b8000, Error code: 0x0000000000000000, Fault CPU: 0x6 ...
It's likely that 0xffffff80639b8000 is the start of an unmapped page. Thus when the mov instruction in the com.apple.kext.AMDRadeonX4150 kext attempts to read from that unmapped address, an unhandled page fault occurs, and the system panics.
So now we know specifically what triggered the kernel panic. However, I don't know 100% why. That is to say I'm still not sure why the invalid memory address was computed. Digging deeper, I'd seek to answer the following questions:
- Was the base pointer (R12) corrupted or invalid?
- Or does the offset register, RAX, hold an invalid (e.g. too large) offset?
- Or perhaps it's something total different (perhaps a random hardware issue)?
In this case, it appears that the computed address 0xffffff80639b8000, invalidly pointed to an unmapped page in kernel memory - as such, a panic ensued. However, what if instead the address invalidly pointed to a mapped page? Ah well, things might prove to be more interesting! Why? First a panic would not occur and secondly we may be able to leak (random) kernel memory to user-mode, leading to amongst other things a kASLR bypass.
Recall that the faulting instruction attempts to dereference a dword value into the R8 register. A few instructions later, the snprintf function is invoked:
  ffffff7f8c7ba8af   mov        eax, eax
  ffffff7f8c7ba8b1   mov        r8d, dword [r12+rax*4] ;faulting instruction
  ffffff7f8c7ba8b5   xor        eax, eax
  ffffff7f8c7ba8b7   lea        rdx, qword [aC08x]     ; "%c%08x"
  ffffff7f8c7ba8be   call       0xffffff7f198091e8     ;  snprintf
In terms of calling conventions, macOS conforms to the 'System V AMD64 ABI'. This means R8 is the 5th argument to a call such as snprintf.
int snprintf(char *str, size_t size, const char *format, ...);
In this case, as snprintf is invoked with the "%c%08x" format string, the 5th argument will map to the "%08x". As such, the integer value held in R8 will be written into a buffer.
Since this code is invoked by the writeDiagnosisReport function it seems reasonable to assume that the snprintf'd buffer (containing the value from R8) may be written out to user-mode. Again, since it appears the computed address (which is used to extract a value into R8), may point outside the bounds of the mapped buffer, this code may leak random kernel data into the diagnosis report!
Of course this is all hypothetical at this point...but still, seems somewhat likely ;)
Conclusion
In this blog post we analyzed a kernel panic report in order to track down the reason and specific cause of system panic. In short, a memory address that pointed to an unmapped page, was accessed by the com.apple.kext.AMDRadeonX4150 kext.
As the panic is triggered via an invalid read instruction, there is a potential for a kernel information leak. However, unless the faulting instruction is symptomatic of a more pervasive issue, it doesn't appear (at first glance), to be exploitable for something like arbitrary ring-0 code execution. However, I'd loved to be proved wrong!
Still, rather disheartening that Apple is shipping buggy kernel extensions in the latest version of macOS. And speaking of Apple, please consider this blog post as the official bug report ;)
love these blog posts & tools? you can support them via patreon! Mahalo :)