Today’s blog post is brought to you by:

|

|

Background
As a casual macOS bug hunter, I often wonder (worry?) if the number of bugs in Apple’s desktop operating system are decreasing. Good news, in each new release of macOS, it appears that new bugs are constantly added!
In this blog post, we dive into a rather annoying bug apparently introduced in macOS Mojave (10.14). Though it doesn’t have significant security implications, it can bring any macOS Mojave system to its knees… forcing the unfortunate user to hard-reboot their shiny Mac.
It may come as a surprise, but I rarely (if ever) go off hunting for bugs in macOS. Yes, due to my stint at the NSA I’m often looking at things from the viewpoint of a hacker - so occasionally will go off and poke on the OS. However, the majority of the time, I’m minding my own business hard at work on tools such as LuLu or TaskExplorer. But often tool development is enough to uncover serious vulnerabilities in macOS (such a kernel mode panic or a kernel mode heap-overflow).
When Mojave was released, I started to receive reports from users, that TaskExplorer would cause the entire system to fully hang…badly. Like, even the spinning beach ball of death would refuse to spin. A hard reboot was the only option that would bring Mojave back to life.
Mac users were understandably rather upset (at me):
“People cannot afford to lose their work / logs as a result of a crash that you know is likely to happen once Task Explorer is opened. From one professional to another, this appears extremely careless and unfair.”
Besides inconveniencing users, (and yah, not stoked to be labeled “extremely careless”), I was rather perturbed as TaskExplorer had been running without issue for the better part of a year. Was a change in Mojave ultimately responsible for the system lock-up? Let’s find out!
TaskExplorer and Loaded Library Enumeration
TaskExplorer is a neat utility that allows one to visually explore all the tasks (processes) running on your Mac. For example you can quickly see a task’s signature status, loaded dynamic libraries (dylibs), open files, network connection, and much more.
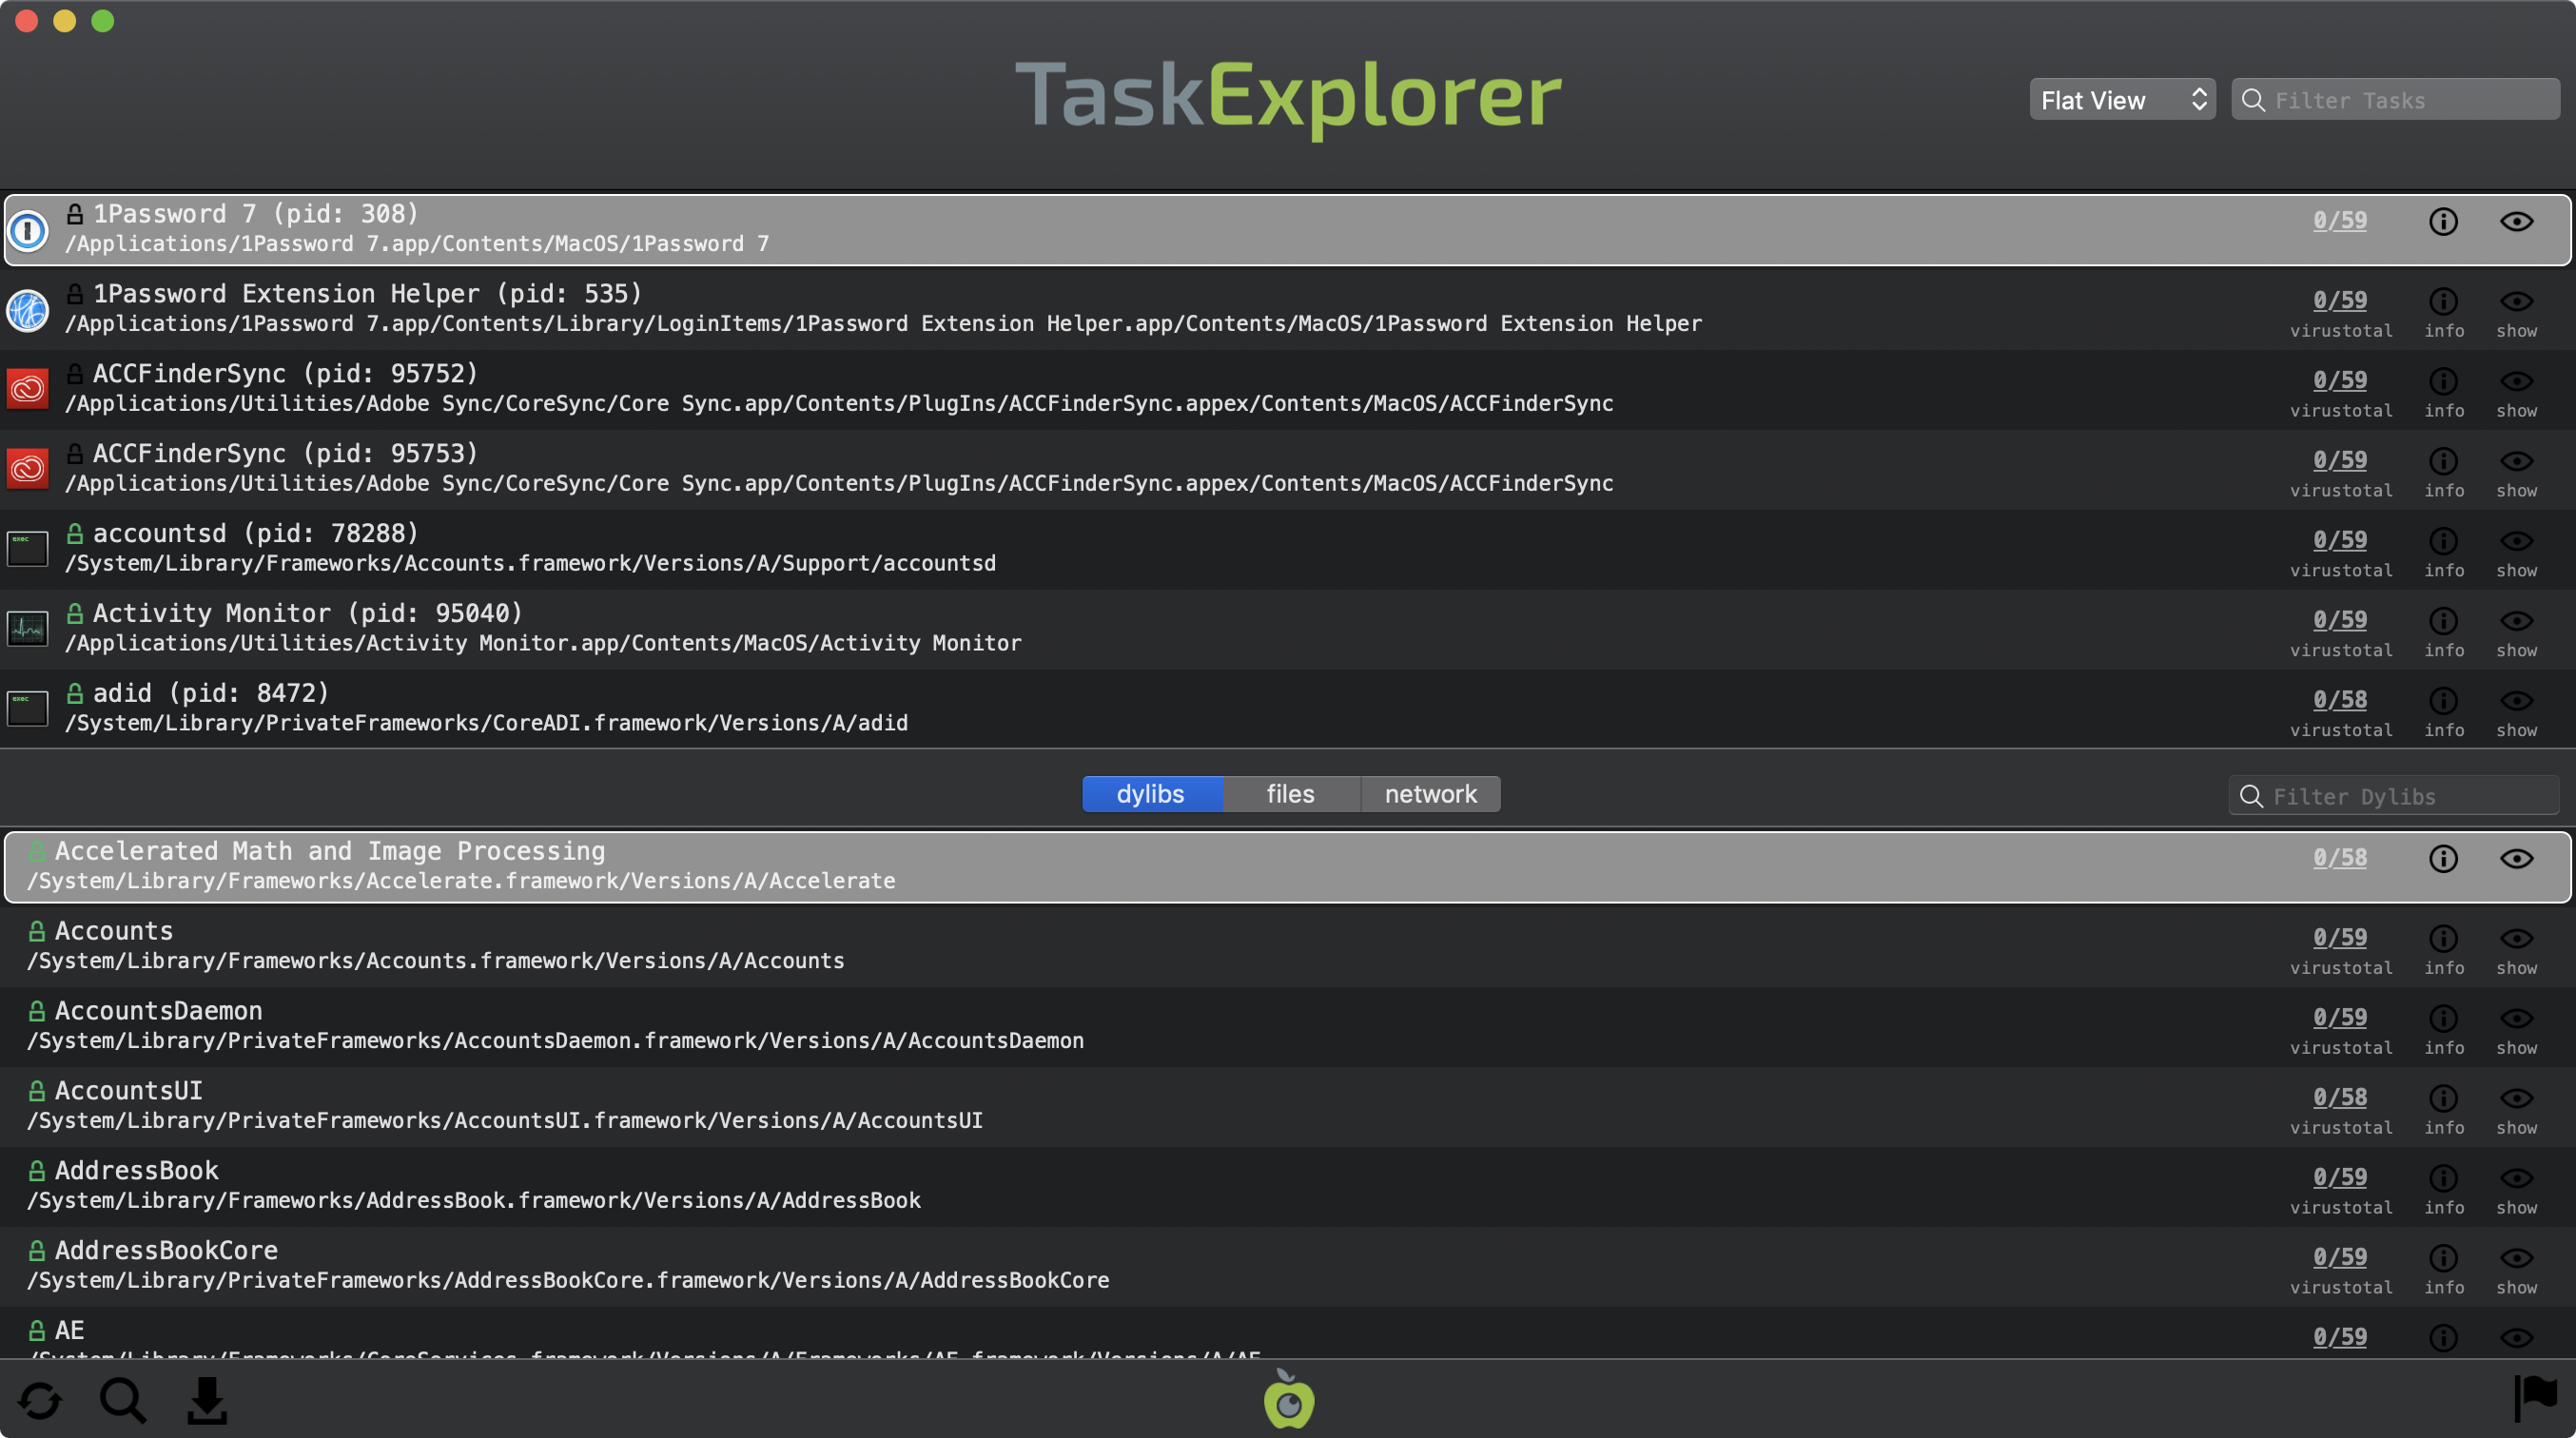
During both malware detection and bug hunting, being able to view what dylibs are loaded into a process, is invaluable. For example via TaskExplorer, I stumbled upon CVE-2018-4403, when I noticed the com.apple.dock.extra process had loaded untrusted (i.e. 3rd-party) dylibs into its entitled address space:
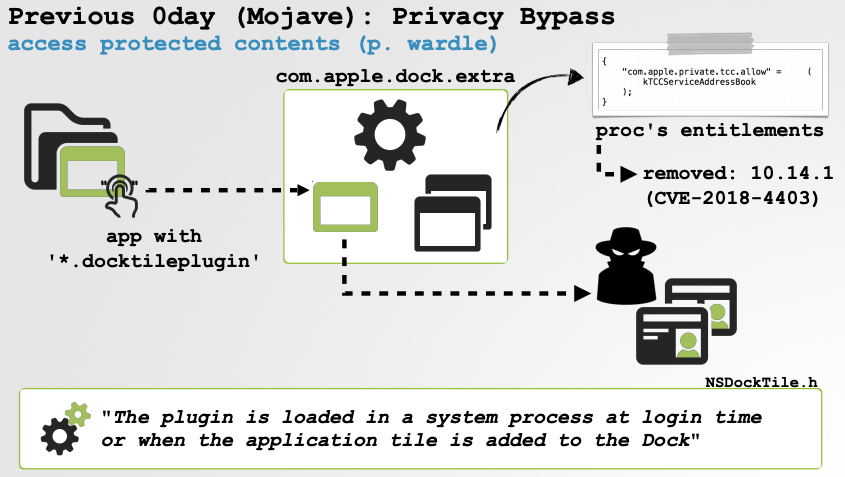
Many exploits rely on an entitled process loading an attacker controlled dylib. Entitlements (which afford process special rights), are applied at the process level. Thus, a dylib loaded into a entitled process automatically inherits its entitlements!
To view the entitlements of a process either use the command: codesign -d –entitlements - /path/to/application, or via the GUI by means of the Whats Your Sign utility.
In terms of malware detection, advanced macOS malware may run as a dylib to persist (i.e. via dylib hijacking) or to avoid detection.
Apple’s built-in Activity Monitor application does not show what libraries a process has loaded. Thus, if a malicious backdoor is compiled as a dylib, it is clear to understand why it may be difficult to detect (vs. a standalone binary or application that would be readily visible).
So how does TaskExplorer enumerate loaded dylibs?
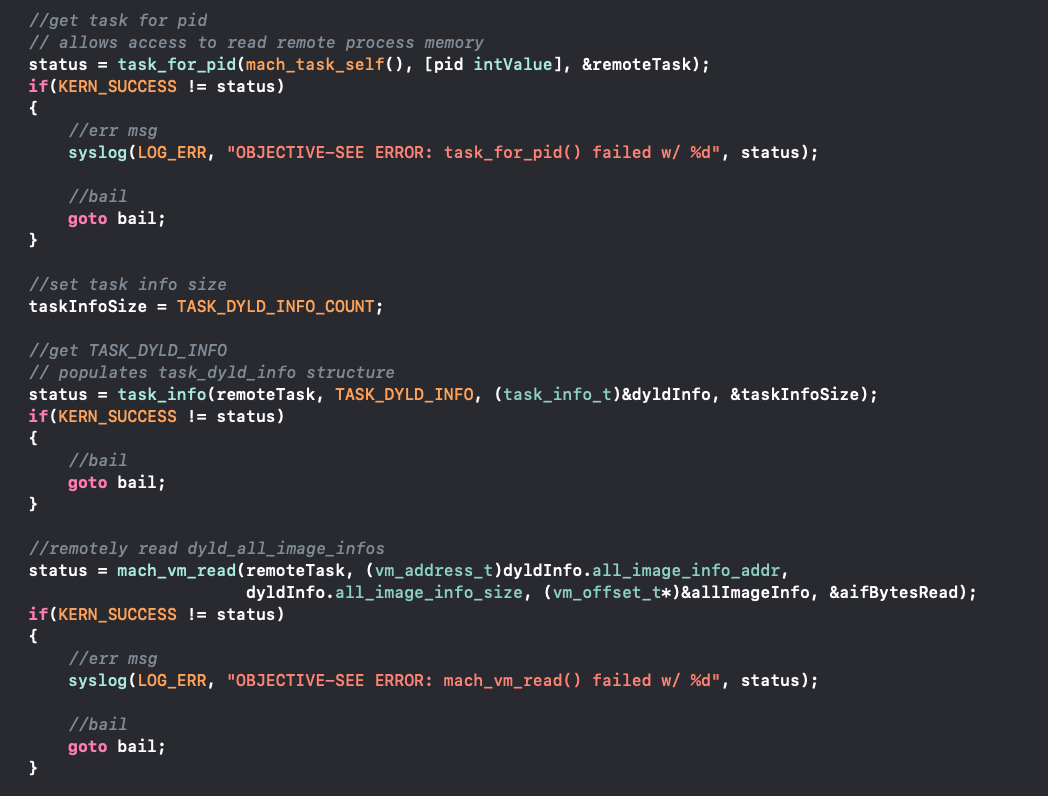
On older versions of OSX/macOS, TaskExplorer is able to directly enumerate dylibs that are loaded in a remote processes, by reading said process’s memory. This is accomplished in the following steps:
Invoking the
task_for_pidfunction to retrieve a task port to the remote process.
This allows TaskExplorer to read the memory of the remote process.Invoking the
task_infofunction with theTASK_DYLD_INFOparameter to populate atask_dyld_infostructureInvoking the
mach_vm_readfunction to read alldyld_all_image_infostructuresInvoking the
mach_vm_readfunction to read the array ofdyld_image_infostructuresIterating over all
dyld_image_infostructures and invoking themach_vm_readfunction to read the address to each loaded dylib’s path.
End result, a list of the paths of all dylibs loaded in the remote process.
This was all well and good.
It should be noted that stealthy malware can “unlink” itself from the list of dyld_image_info structures. However, this technique has yet to be observed in the wild!
Unfortunately for TaskExplorer, on recent version of macOS, Apple no longer allows 3rd-party utilities to retrieve a remote process’s task port. Specifically, the task_for_pid call will always fail - even if the caller is executing with root privileges. Without a (remote) process’s task port, TaskExplorer cannot read its remote memory and thus cannot enumerate loaded dynamic libraries :(
However, we can work around this limitation by using Apple vmmap utility! Unlike 3rd-party utilities which are effectively blocked from accessing remote process (even to simply enumerate loaded dylibs), Apple utilities still can. How? They have the mighty com.apple.system-task-ports entitlement:
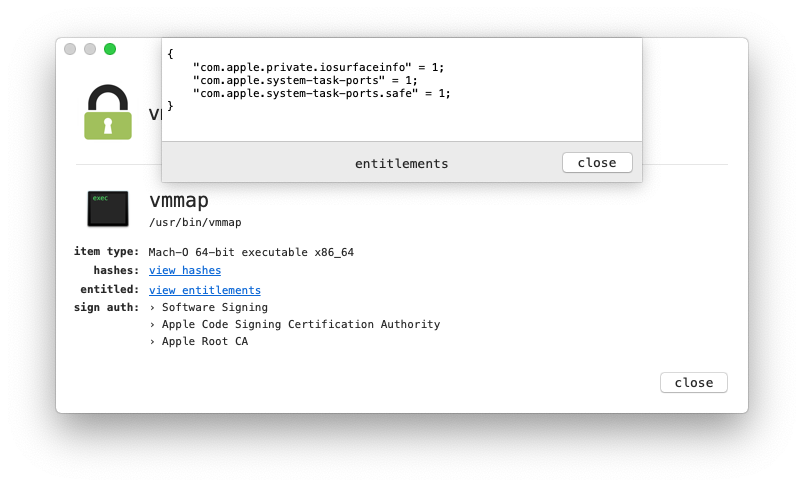
According to its man page, the vmmap utility will “display the virtual memory regions allocated in a process” …which also includes the path of the binary that “backs” relevant memory regions.
Here, we dump the memory regions of Calculator.app (pid: 1985):
$ ps aux | grep Calculator
patrick  1985 /Applications/Calculator.app/Contents/MacOS/Calculator

$ vmmap -w 1985
Process:         Calculator [1985]
Path:            /Applications/Calculator.app/Contents/MacOS/Calculator

...

==== Non-writable regions for process 1985
REGION TYPE            REGION DETAIL
__TEXT                 /Applications/Calculator.app/Contents/MacOS/Calculator
__LINKEDIT             /Applications/Calculator.app/Contents/MacOS/Calculator

...

__TEXT                 /usr/lib/dyld
__TEXT                 /System/Library/Frameworks/AppKit.framework/Versions/C/AppKit
__TEXT                 /System/Library/Frameworks/CoreGraphics.framework/Versions/A/CoreGraphics
As vmmap can (indirectly) display the loaded dylibs in a remote process (even on modern versions of macOS), I had previously updated TaskExplorer to simply execute vmmap and then parse its output in order to (still) enumerate loaded dylibs:
//exec vmmap
execTask(VMMAP, @[@"-w", [pid stringValue]], YES);

//iterate over all results
// line by line, looking for '__TEXT'
for(NSString* line in [output componentsSeparatedByCharactersInSet:
   [NSCharacterSet newlineCharacterSet]])
{

  ...

  //extract dylib's path
  dylib = [[line substringFromIndex:pathOffset.location] stringByTrimmingCharactersInSet:
           [NSCharacterSet whitespaceCharacterSet]];

  //add to results array
  [dylibs addObject:dylib];

}
This was all well and good …until Mojave.
Death to macOS!?
As previously noted, when Mojave was released, users reported that TaskExplorer would cause the entire system to fully lock up. I was able to easily replicated the bug, both in a VM and on my personal system. A hard (manual) reboot was the only way to bring the macOS system back to life.
Digging into TaskExplorer’s code, I quickly tracked down the code responsible for triggering the system deadlock. Turns out when TaskExplorer invoked vmmap in order to enumerate the loaded dylibs in a remote process, the system would lock. Exploring further, I determined that this lockup would only occur when the remote process had the process id (pid) of 1.
To replicate this bug, from a root (or sudo) prompt, run: vmmap 1
Note this will lock up any macOS Mojave system!
What’s special about process id (pid) 1 and more importantly, why does this crush macOS Mojave? Let’s dig into these questions.
First, pid 1 always belongs to launchd …which is directly executed by the kernel during the system boot process. As the first user-mode process, its pid is understandably 1! It is the arbitrator of many (all?) other user-mode processes, and if launchd would ever become uncommunicative, the system would quickly devolve into a point of no return (yes, foreshadowing!).
This brings us to our next question, why does vmmap 1 cause macOS to lock up!? Only one way to find out - let’s dive into vmmap's code!
First, recall that vmmap can enumerate the virtual memory regions allocated in a (remote) process…such as launchd. In order safely do this, it first suspends the process, enumerates allocated memory regions, the resumes the process.
We can observe this in a debugger (setting a breakpoint on task_suspend):
(lldb) settings set target.run-args 1
(lldb) b task_suspend
Breakpoint 1: where = libsystem_kernel.dylib`task_suspend, address = 0x00000000000136f5
(lldb) r
Process 539 launched: '/usr/bin/vmmap' (x86_64)
Process 539 stopped
* thread #1, queue = 'com.apple.main-thread', stop reason = breakpoint 1.1
    frame #0: 0x00007fff59cf46f5 libsystem_kernel.dylib`task_suspend
libsystem_kernel.dylib`task_suspend:
->  0x7fff59cf46f5 <+0>: pushq  %rbp
    0x7fff59cf46f6 <+1>: movq   %rsp, %rbp
    0x7fff59cf46f9 <+4>: pushq  %rbx
    0x7fff59cf46fa <+5>: subq   $0x38, %rsp
Target 0: (vmmap) stopped.
(lldb) bt
* thread #1, queue = 'com.apple.main-thread', stop reason = breakpoint 1.1
  * frame #0: 0x00007fff59cf46f5 libsystem_kernel.dylib`task_suspend
    frame #1: 0x00007fff54371020 Symbolication`task_start_peeking + 48
    frame #2: 0x0000000100004a89 vmmap`___lldb_unnamed_symbol63$$vmmap + 68
    frame #3: 0x0000000100002abe vmmap`___lldb_unnamed_symbol33$$vmmap + 355
    frame #4: 0x0000000100005596 vmmap`___lldb_unnamed_symbol66$$vmmap + 1302
    frame #5: 0x0000000100001c37 vmmap`___lldb_unnamed_symbol1$$vmmap + 1687
    frame #6: 0x00007fff59ba8ed9 libdyld.dylib`start + 1
    frame #7: 0x00007fff59ba8ed9 libdyld.dylib`start + 1
(lldb)
In the debugger backtrace (bt), we can see that Symbolication'task_start_peeking calls task_suspend to suspend the process, before taking a memory ‘snapshot’.
Shortly thereafter, vmmap attempts to symbolicate the memory regions. It does this via the private CoreSymbolication framework. As part of this symbolication, it invokes the CoreSymbolication'mmap_storage_daemon function, which in turns calls into the CSCppDaemonConnection::CSCppDaemonConnection method:
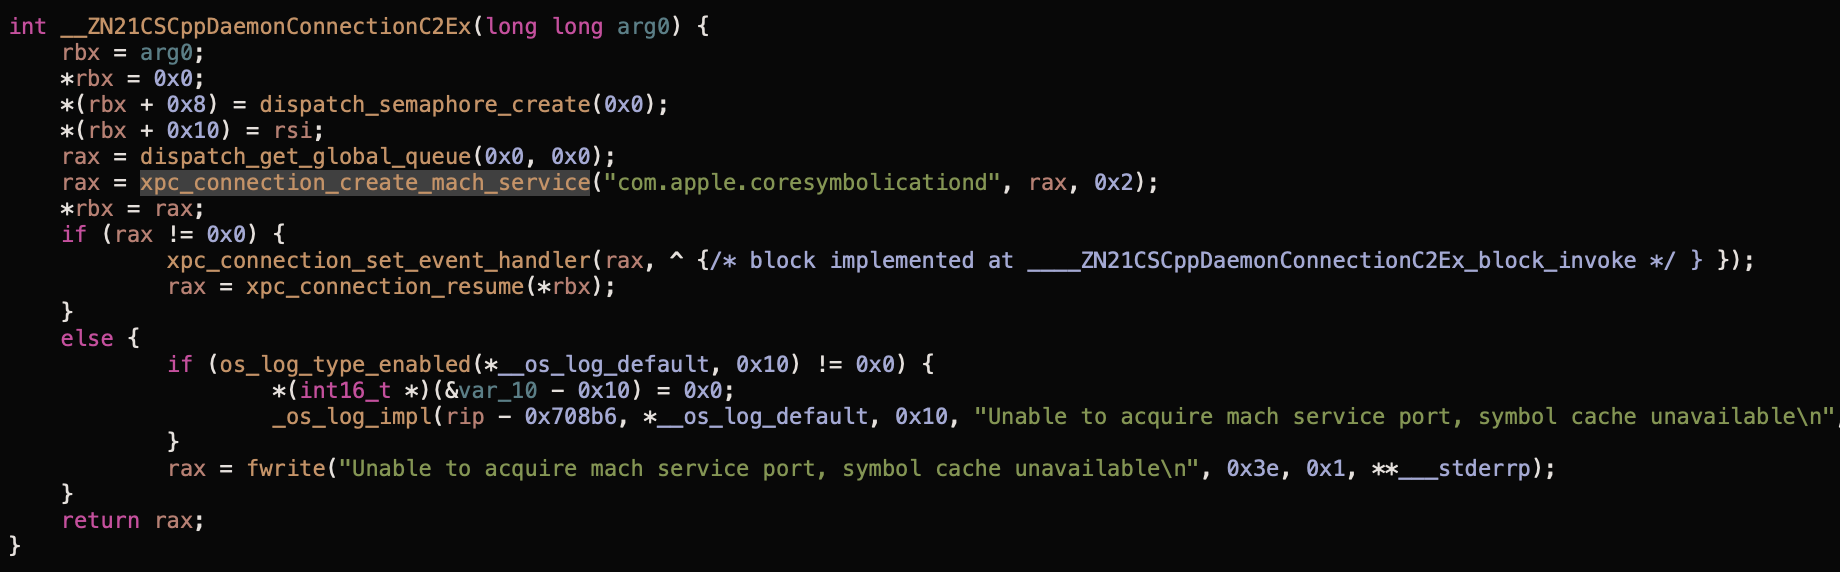
In the above disassembly of the CSCppDaemonConnection::CSCppDaemonConnection method, note the various XPC calls such as xpc_connection_create_mach_service and xpc_connection_resume.
XPC is an interprocess communication (IPC) mechanism of macOS that is largely facilitated by launchd. When the symbolication logic within vmmap invokes such methods (specifically the xpc_connection_resume method which in turn calls the _xpc_look_up_endpoint function) these are routed to launchd.
Unfortunately as launchd has been suspended (by vmmap), these XPC requests are never serviced - and instead block …meaning vmmap hangs (awaiting a response), meaning launchd is never resumed (by vmmap), which means the entire system grinds to a halt, and dies a horrible horrible death.
The exact XPC call that appears to block (and hence trigger the deadlock) is a call to libxpc’s _xpc_look_up_endpoint function.
The endpoint it is trying to resolve is: com.apple.coresymbolicationd.
Uggh, so all is not well nor good! But hey, at least we now know why vmmap 1 deadlocks the system! Go tell all your friends to run this command on their Mojave boxes. If they yell at you, tell them to blame Cupertino’s Q&A (or lack thereof) 🤭
Conclusion
In this blog post, we dug into why (on macOS Mojave) executing vmmap against launchd (pid 1), deadlocks the entire system. In short, after vmmap has suspended launchd it (indirectly) attempts to ‘call’ into launchd via XPC. As launchd has been suspended (by vmmap), everything grinds to a halt.
Once again, tool development (TaskExplorer) was enough to uncover a rather serious flaw, this time in an important Apple utility. I’ve reported this bug to Apple, who have promised to help get it resolved!
In the meantime, I’ve updated TaskExplorer to work around this bug, specifically skipping launchd when enumerating loaded dylibs (on Mojave and above):
//on mojave
// skip launchd (apple bug)
if( (1 == self.pid.integerValue) &&
    (getVersion(gestaltSystemVersionMinor) >= OS_MINOR_VERSION_MOJAVE) )
{
    //skip
    return;
}
As noted, older versions of OSX or macOS are not affected. Though I haven’t dug to much into why, it appears that the XPC endpoint resolution is handled in a more graceful manner. Specifically it directly fails with: Invalid connection: com.apple.coresymbolicationd. In this case, such a failure is a good thing, as vmmap can continue and resume launchd (vs. remaining hung as the entire system deadlocks).
Let’s end this post with a plea Apple:
Please provide an API for trusted, privileged security tools to enumerate dylibs loaded into remote processes.
Or, if you’re going to force us to use your own tools (i.e.
vmmap) to accomplish such tasks, please please please test them!
Love these blog posts & tools?
You can support them via my Patreon page!