▪️ Slides: “The Hidden Treasures of Crash Reports”
▪️ In the News: “Computer Crash Reports Are an Untapped Hacker Gold Mine”
Background
Sadly, nobody really loves crash reports, but I’m here to change that!
This research, a crash course on crash reports, will highlight how these often overlooked files are an invaluable source of information, capable of revealing malware infections, exploitation attempts, or even buggy (exploitable?) system code. Such insights are critical for defense and offense, empowering us to either protect or exploit macOS systems.
To start, we will explain exactly how to understand the structure and information provided in a crash report. Then, we’ll show how this information, which often serves as little more than a digital breadcrumb, can however ultimately reveal the exact cause of the crash. Of course, this journey requires a solid understanding of reverse engineering, so we’ll briefly touch on topics such as disassembling and debugging ARM64.
Next, we’ll apply what we’ve learned to work through various real-life crashes that revealed flaws such as uninitialized pointers, use-after-frees, and heap overflows. And yes, some still exist on macOS even today.
But first, who should care? Well, in my option, (almost) everybody, including:
-
Users
When software crashes, it can be very frustrating for end users. However, with a basic understanding of crash reports—such as knowing that a report is generated when a program crashes and where to find it—users can create more detailed bug reports, helping developers fix the issue more effectively. End result? More reliable (and secure) software, that benefits yes the user, but really everybody (ok, maybe not hackers). -
Developers
No one writes perfect software (though we all wish we could!). When a program crashes, the first step in fixing it is understanding what went wrong, and crash reports are undoubtedly one of the best tools for this. That’s why crash reports are often a developer’s best (and only? ha!) friend. -
Security Professionals
If you’re a threat hunter or malware analyst, examining every crash report you can get your hands on is a must. Why? There are several reasons, such as the fact that failed exploitation attempts often generate crash reports. Additionally, malware, which tends to be more error-prone than legitimate software, may crash, leaving behind a trail of crash reports that can reveal its otherwise undetected presence. Let’s dive into some specific examples.
As noted in my talk, all the way back in 2008, Microsoft uncovered an incredibly powerful 0day exploit. How? By identifying two crash reports (out of millions collected through Windows Error Reporting) that were a result of failed exploitation:
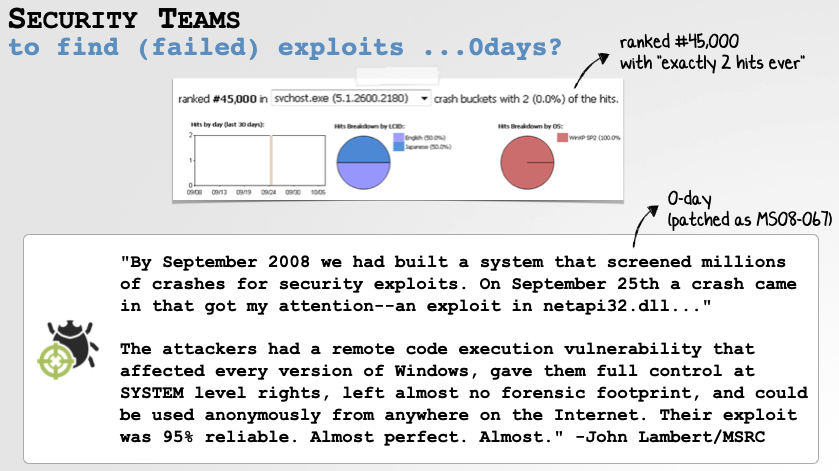
Microsoft Uncovered a Powerful 0day via Crash Report Analysis.
You can read more about this intriguing discovery in, “The Inside Story Behind MS08-067”
On to malware detection, remember Stuxnet? It was originally discovered when it started crashing systems. And more recently (and more relevant to macOS), the initially undetected malware known asZuRuwould also sometimes crash, generating a crash report that could reveal the presence of the malware on the system:
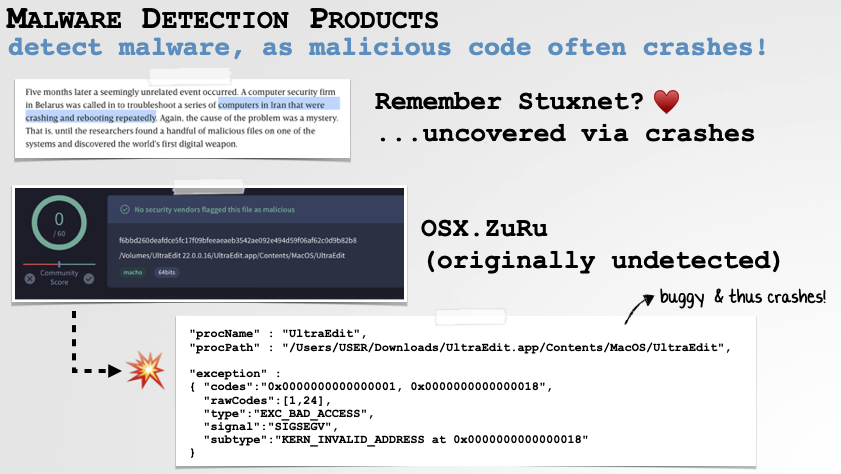
Malware Detection via Crash Reports.
It also behooves malware analysts to understand crash reports, as sometimes malware will crash, before its analysis is completed. In the following example, LockBit’s macOS ransomware would crash (generating a crash report) before its malicious logic would complete. For analysis purposes this premature termination was problematic as I needed to study it wholly and also test my ransomware detection tools against it. Understanding the crash report revealed the bug in the malware and allowed me to directly patch its binary to ensure it could run to completion (for analysis and testing purposes only of course):
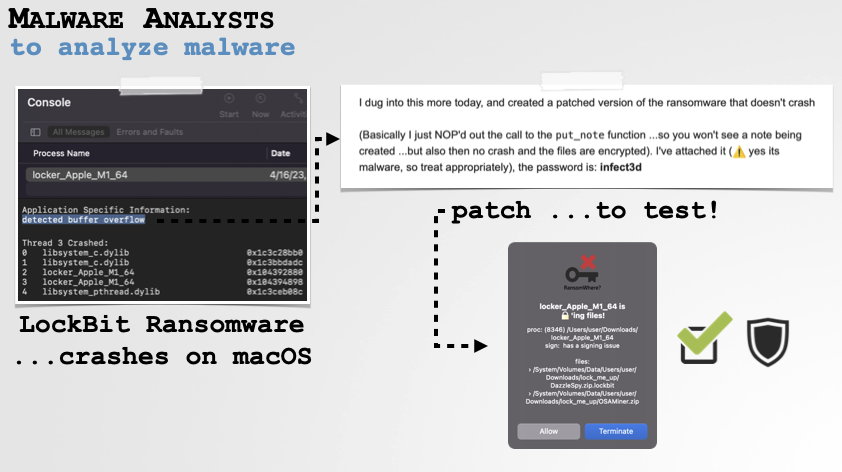
Crash Reports can Facilitate Malware Analysis. -
Intelligence Agencies
Apparently, (according to the media), intelligence agencies are rather fond of collecting crash reports as well!
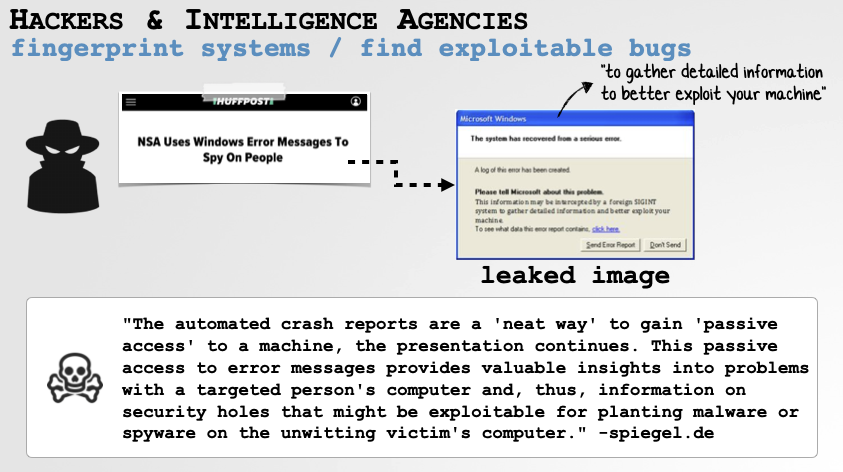
Intelligence Agencies Appear to be Interested in Crash Reports!
Finally, worth noting, crash reports are in someways a source of “absolute truth”. Take for example the recent CrowdStrike fiasco …which caused a myriad of misinformation. Erroneous claims including blaming Microsoft for the source of bug, and that the core issue was a NULL-pointer dereference:
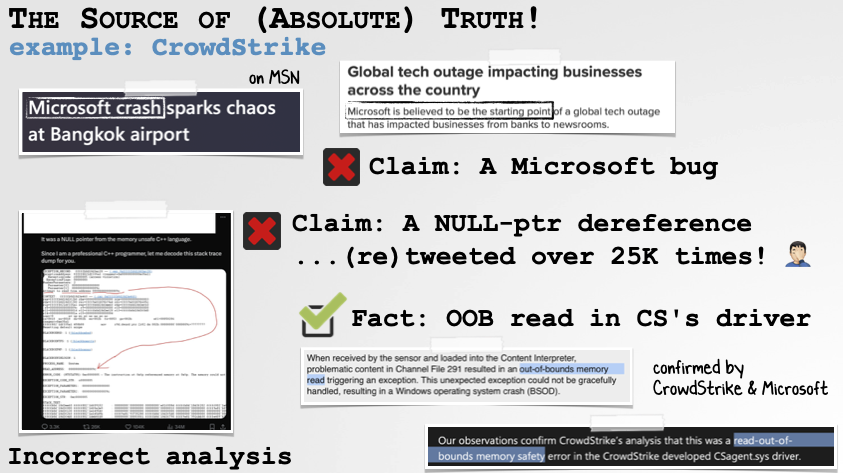
Crash Reports can Dispel Misinformation
…when the crash report was read (correctly), it was clear that it was a bug in CrowdStrike’s kernel driver …and not a a NULL-pointer dereference, but rather an out-of-bounds (OOB) read. This was all subsequently confirmed by both CrowdStrike and Microsoft.
Crash Report Basics
But wait, we haven’t even defined what crash reports are! Well, as their name implies, Apple notes that they are “system and user reports about applications and processes that crash”
On macOS, you can view crash reports in Console.app (just click on “Crash Reports”). This just reads from either of the two crash report directories, which you can also directly browse to:
/Library/Logs/DiagnosticReports/~/Library/Logs/DiagnosticReports/
Crash reports generated on Apple systems have the .ips file extension.
Let’s now walk through an example crash report that was generated purposefully via the buggy code:
1int main(int argc, const char * argv[]) {
2    char* a = NULL;
3    *a = 0x41;
4}
The code sets a pointer (a) to NULL, then attempts to dereference it to store the value 0x41 within it. No surprises, but when we compile this into a program (named “I Will Crash”) and run it, this causes a crash (a NULL pointer dereference) and thus a crash report is generated.
We’ll use this example to highlight relevant parts of crash reports and show how you can figure out the underlying cause …even if you didn’t have the source code for the program that crashed in the first place!
To start, if we open the crash report we’ll see:
-
Basic Information
This includes information about the program (its path, version, etc.) and the operating system versioning. This is important and sometimes crashes are version-specific:
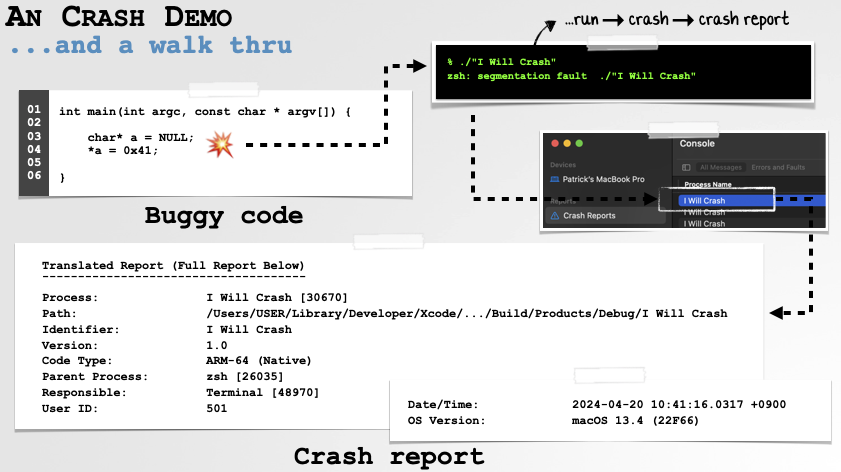
Crash Reports Start with Basic Program and OS Information. -
Crashed Thread & Exception Information
Programs are often multi-threaded and thus its relevant to know which thread crashed. As our example program is single-threaded, the crash report shows “thread 0” as the thread that crashed.
We also see that the crash report contains basic “exception information” that includes the exception type and then exception type specific codes. Here it states the crash was due to a bad access (SIGSEGV, aka “signal segmentation violation”), due to invalid address of 0x0 (i.e. NULL):
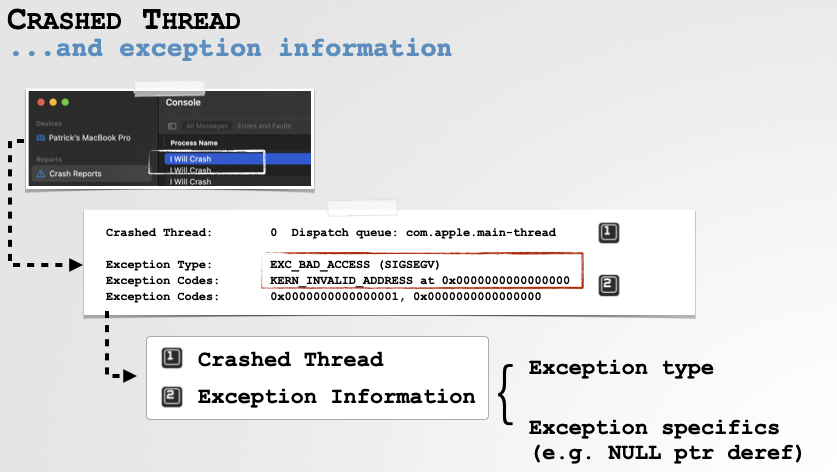
The Crashed Thread and Exception Information.
From this, we already likely know why the program crashed: a NULL-pointer dereference.
-
Stack Backtrace
Often the instruction that triggered the crash (known as the “faulting instruction”) is not the actual source of the bug. Though, ok, in this example crash it is, but in many other cases you’ll see a crash in a well-known system API. 99/100 times there is no bug in the API, rather it was invoked with an invalid argument! This is where the stack backtrace comes into play, as it shows you the sequence of calls that lead up to the crash …which can, for example, quickly show if a caller is to blame!
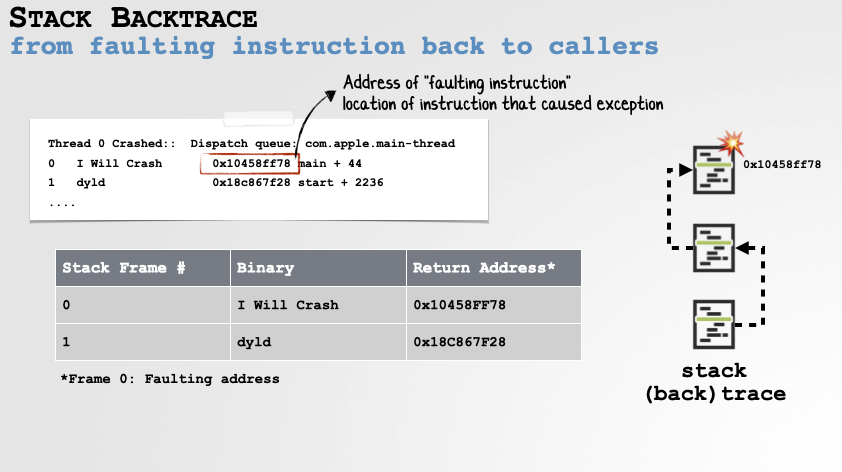
The Stack Backtrace is an Invaluable Part of the Crash Report. -
Thread State
On Apple devices, crash reports by design, have limited context …for example, they don’t provide a (full) memory snapshot of the crashed program. However they do contain the state of the crashing thread at the time of the crash:
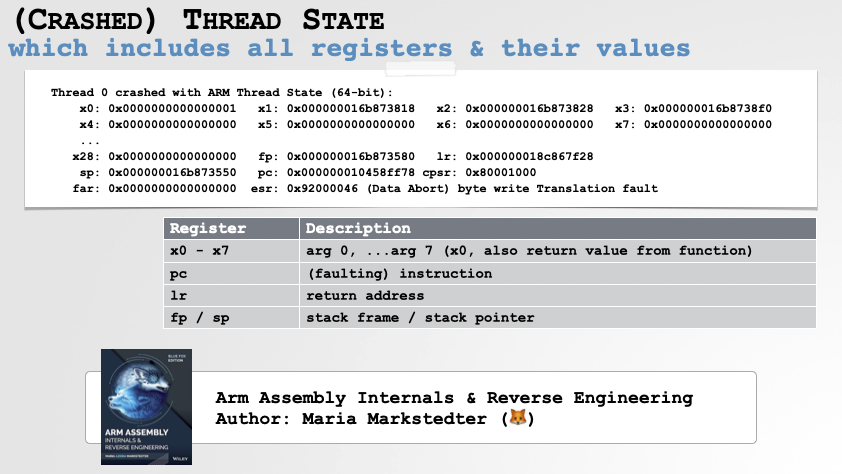
The Crashed Thread State contains the Value of Registers at the Time of the Crash.
…this holds a snapshot of values of all the registers from the time of the crash. This information is often invaluable when attempting to ascertain the underlying cause of the bug! We’ll see this subsequently when discussing the faulting instruction. But first lets talk about loaded binaries. -
Loaded Binaries
The crash report also contains a list of all binaries that are loaded in the process’ address space at the time of the crash. This is helpful as sometimes the crash occurs not in the program’s main executable, but rather in a library or framework it has loaded:
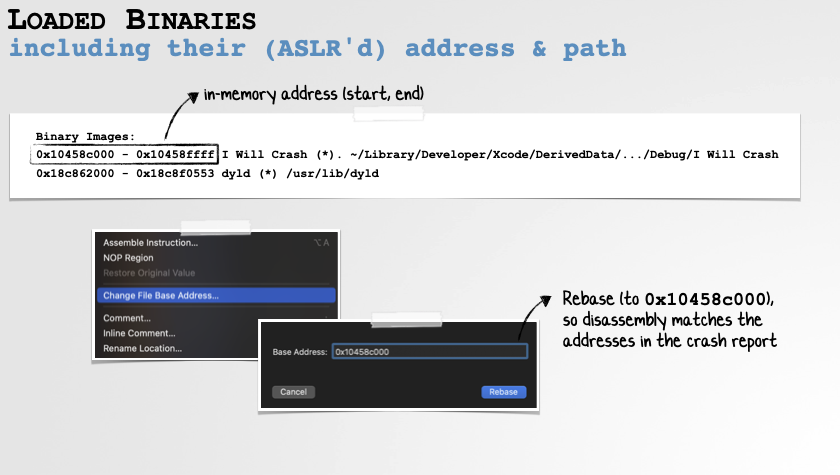
Loaded Binaries and their Addresses can be used for Rebasing.
This section of the crash report also contains the addresses of the loaded binaries, which you’ll want to make use of when loading them in a disassembler …as likely the address they were loaded in the memory at the time of the crash will be different than their preferred/base load address. The key is to rebase the binary (when loaded in a disassembler) to ensure addresses line up with those in the crash report. -
Faulting Instruction
Finally, we have the faulting instruction. This is the instruction that causes the fault that triggered the crash. In our example crash, this is at0x10458ff78. You can find the faulting instruction either at the top (index 0) of the stack backtrace, or in the program counter (pc) register in the crashed thread state:
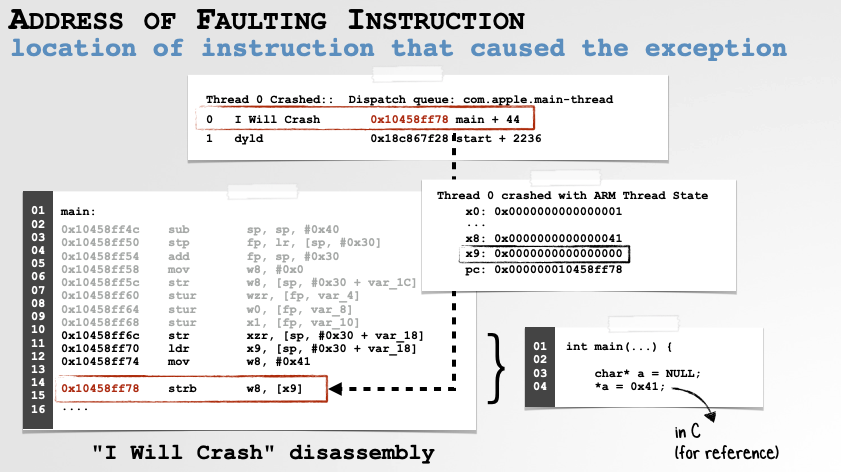
The Faulting Instruction is Where the Crash Occurred
If we open the “I Will Crash” binary in a disassembler (and rebase it to match the address it was loaded in memory, here,0x10458c000), we find the following instruction at0x10458ff78:strb w8, [x9].
This instruction is attempting to store a byte (strb) from thew8register into the memory location whose address is found inx9. Looking at either the disassembly or the crash thread state in the crash report you can see thex9register is set to NULL. Which explains why, the program crashed! You cannot store something at memory address 0x0 (NULL)!
With a foundational understanding of how to read crash reports, let looks a few real world macOS & iOS examples!
Real World Crash Reports
YARA
Let’s start with YARA, everybody’s favorite scanning library. I noticed that it would occasionally crash on my macOS system when scanning a file. Not ideal …so let’s head to the crash report.
First, we note that rather oddly the Exception Type is set to “Code Signature Invalid”. This was enough information to lead me down a rabbit hold that revealed the reason for the crash. In short, on macOS if you’re going to scan memory (even read-only memory, such as a file to scan, that you’ve mapped into your own process), you have to use the MAP_RESILIENT_CODESIGN flag. Otherwise if the memory is backed by a file with an invalid signature, macOS will forcefully kill you (generating a crash):
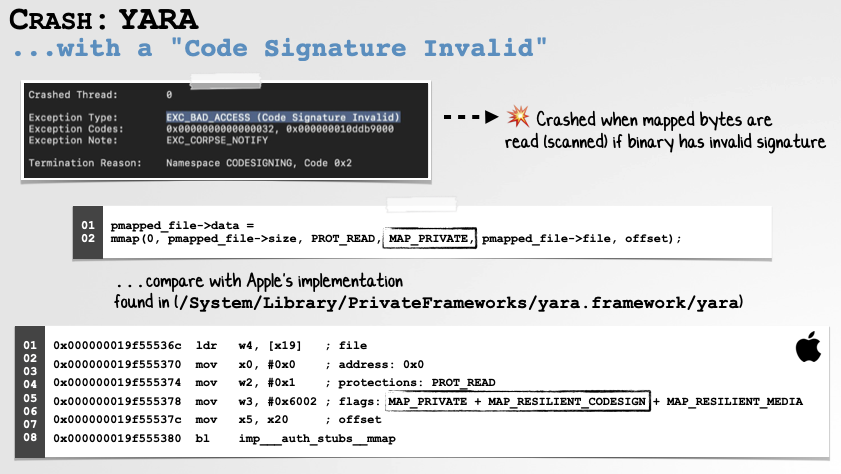
As shown in the above slide, we can see Apple’s build of YARA uses the MAP_RESILIENT_CODESIGN flag, while the open-source version did not.
Thanks to the crash report, I was able to understand exactly what the problem was, and also propose a fix. I submitted a detailed bug report to the YARA project. They quickly pushed out patch, adding the MAP_RESILIENT_CODESIGN to file memory mappings:
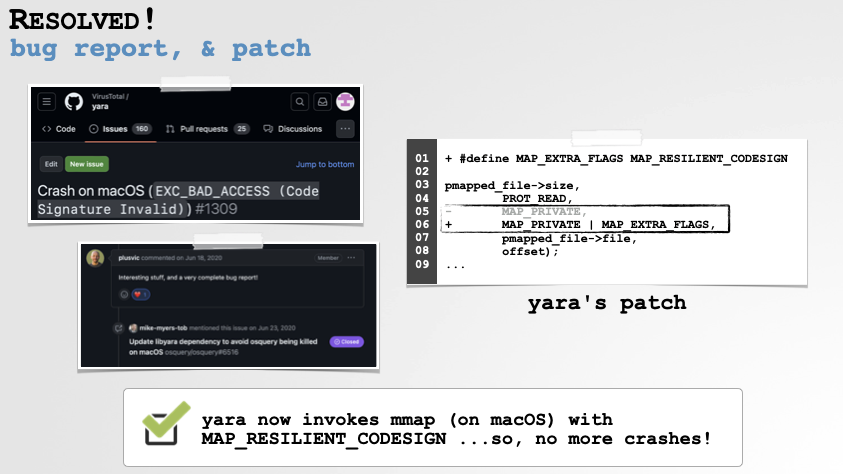
…hooray, no more crashes!
The Kernel
Next, let’s head to the kernel. A few years ago, one of my tools would occasionally crash macOS. This was odd as my tool ran in user mode and thus should not be able to panic the entire system. (Though you as the developer will still get blamed, ha!)
Starting with the faulting address in the crash report (0xffffff800892544b), I was able to map this to problematic instruction to the following line of source code (this part of the kernel was open source): if (sun->sun_path[slen] != 0)
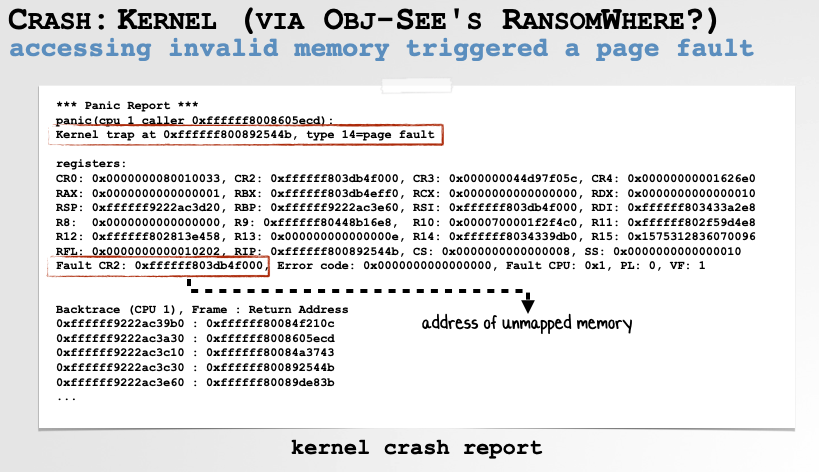
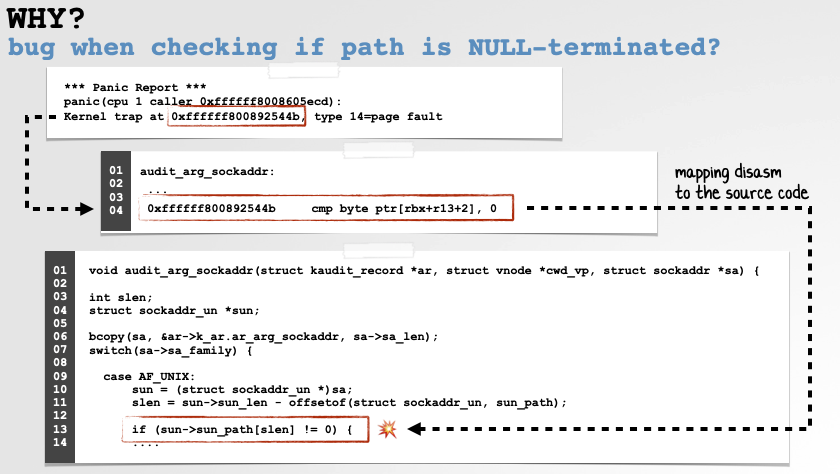
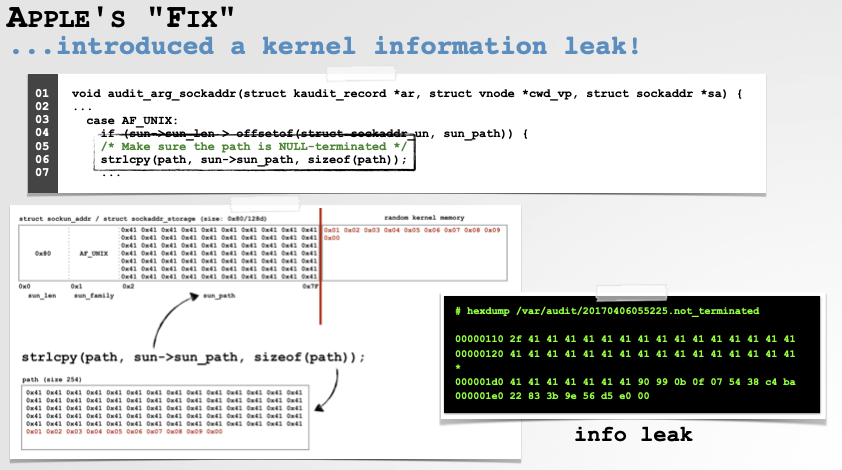
Turns out Apple’s kernel code was checking to see if a socket path was NULL-terminated …but the check was checking outside the bounds of the path, which means it could access unmapped memory, which in the kernel would cause a panic:
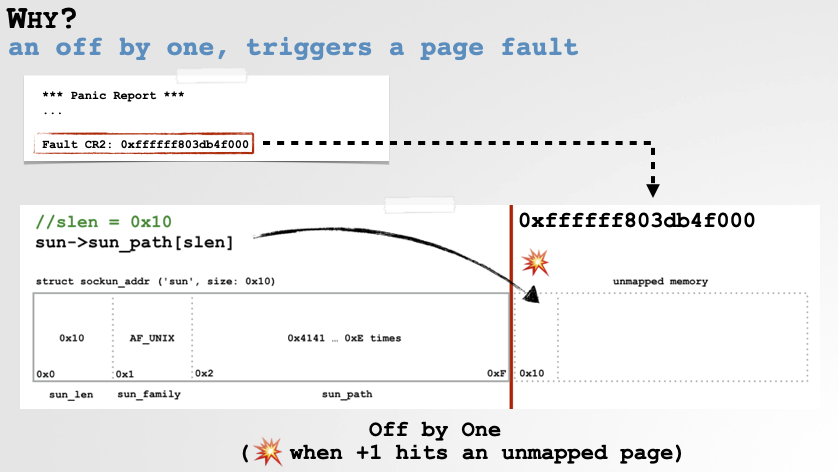
Worse, when I reported this bug, Apple’s initial fix was, not only not a fix, but introduced a kernel information leak:
…and while they were (re)fixing that, I noticed the same function contained a heap-overflow:
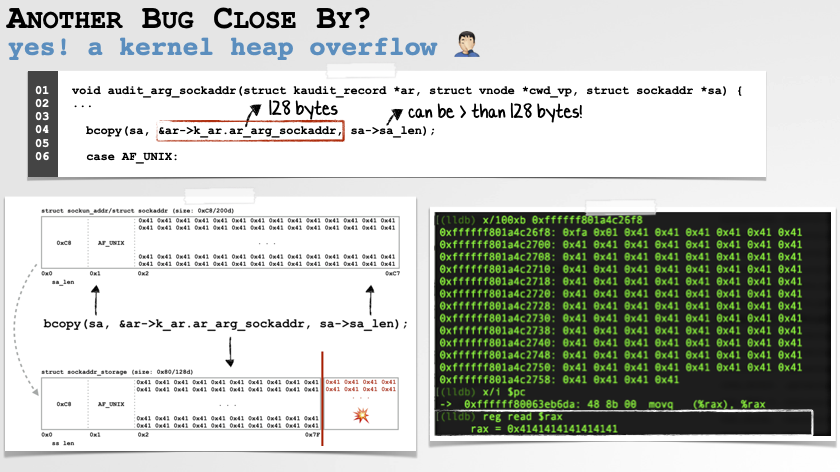
Not a bad haul of bugs, all starting with a single crash report!
iOS
This next bug, though a simple NULL pointer dereference, is interesting as its revealed the fact that Apple had acquiesced to censorship demands of the Chinese government.
It started whenever when I sent my Taiwanese friend as message with the Taiwanese flag (🇹🇼) that caused her phone to crash. This could also be triggered locally on her device by simply typing “Taiwan”:

I wrote a detailed blog post about this bug previously:
Since I previously analyzed the bug in detail, I won’t repeat the full analysis here, but as we can see from the following slides, the issue was Apple forget to check the return value of the CFLocaleGetValue for NULL. And thus, when they compared it with “CN” to see if they should censor the Taiwanese flag, the device would crash:
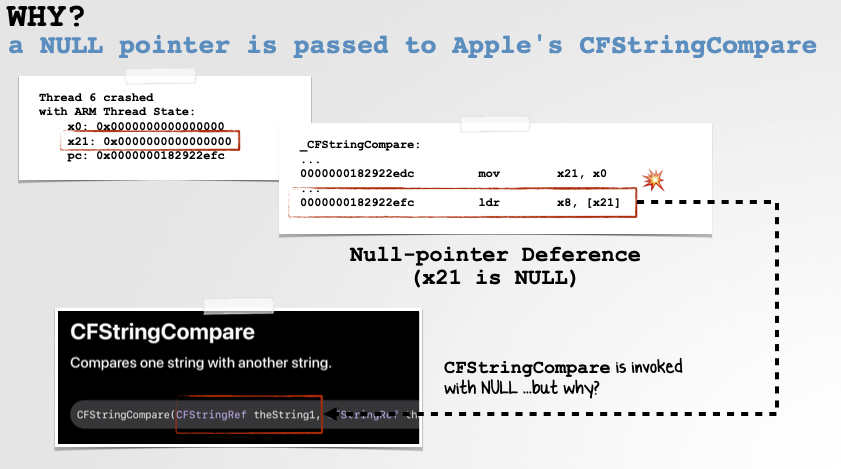
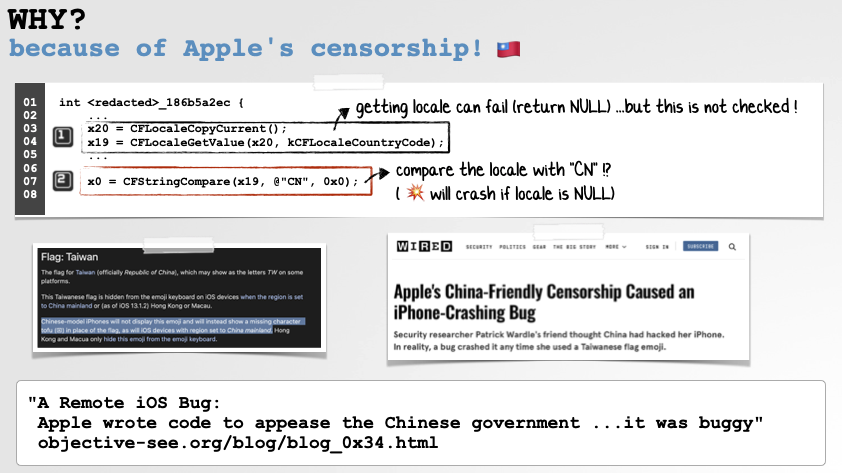
Though this is now fixed, Apple still (happily?) censors content when asked 🤷🏻♂️.
(0day) Network Extension Session Manager
The final bug I want to talk about is currently an 0day, that impacts even the latest macOS 15 betas. It, as is the case with all the bugs mentioned in this post, was found inadvertently when something interesting crashed (by accident) and I decided to dig into the crash report.
In order to facilitate the deprecation of 3rd-party kernel extensions, Apple recently introduced user-mode frameworks to provide roughly the same abilities (that previously were afforded in the kernel). One of these was Network Extensions. A key component of Network Extensions is the Network Extension Session Manager (nesessionmanager). This daemon runs as root, and both loads and then governs all network extensions, which can include security tools such as network monitors and firewalls. Unfortunately its buggy and trivial to crash:
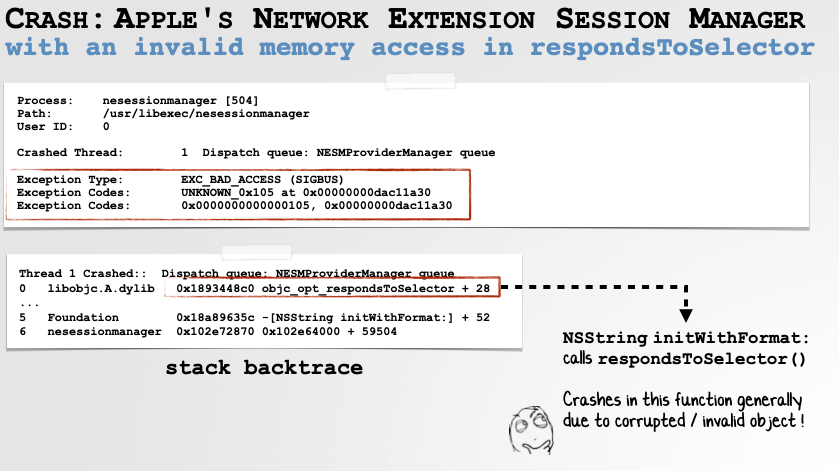
If we analyze the crash report (which was generated when I inadvertently crashed nesessionmanager attempting to load a network extension that I had accidentally corrupted), we find what appears to the underlying cause:
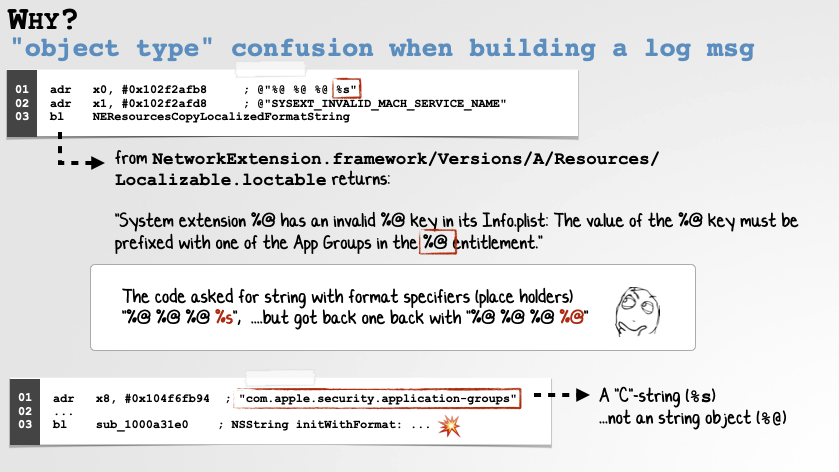
In short, the daemon requests a localized string (key: SYSEXT_INVALID_MACH_SERVICE_NAME) with the format specifiers: "%@ %@ %@ %s". However it gets back the following string, whose final format specifier is a %@ not a %s:
System extension %@ has an invalid %@ key in its Info.plist: The value of the %@ key must be prefixed with one of the App Groups in the %@ entitlement.
This is a problem as %@ specifies that a fully featured object should be provided, while %s, is for a humble sequence of (NULL-terminated) bytes (aka a C-string). Pass the latter to the former and you’ll crash.
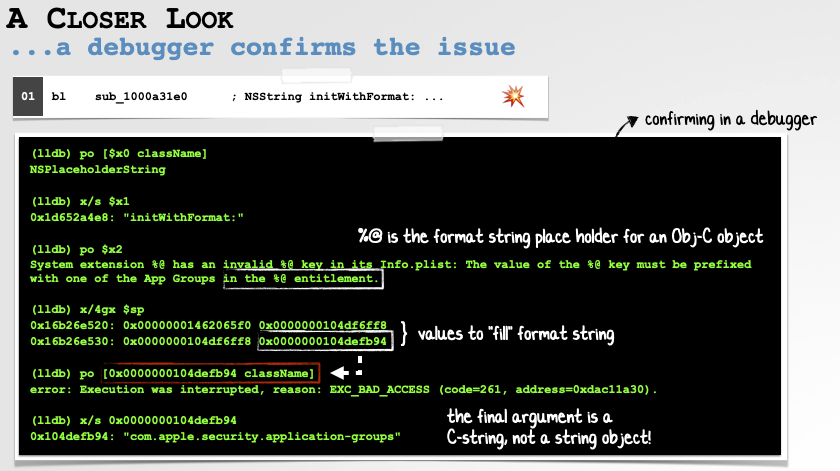
As we can see in the disassembly (and can also be confirmed in a debugger), the code indeed passes a C-string as the last argument though the format string’s final specifier, as we noted, is a %@.
Ok, so we (or unprivileged malware) can trivially crash macOS’s Network Extension Session Manager, so what? Ah, well the issue is, when that goes down, it takes down with it all other network extensions (including security tools such as firewalls):
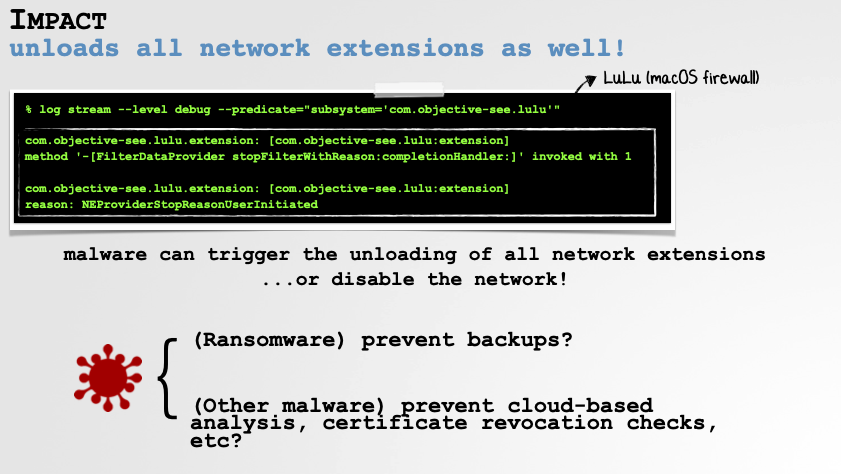
Malware: 1 … Security Tools: 0 😢
Conclusion
Today, we touched on the highlights of my talk on crash reports! If you’re enjoyed this blog post, make sure to read the full slide deck: The Hidden Treasures of Crash Reports …it contains far more details, examples, and other bugs, including an analyis of CrowdStrikes now infamous crash, and other macOS 0days! Moreover, it talks about how to monitor for, collect and process crash reports programmatically.
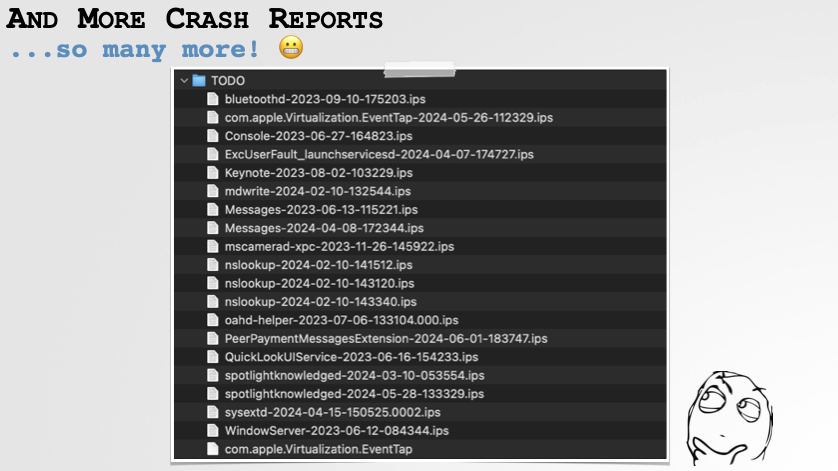
And stay tuned as I have many other crash reports to still dive into:
You can support them via my Patreon page!


